Ground Motion and Damage Correlation – Their Significance in Earthquake Loss Modeling
Upon the occurrence of an earthquake, the damage to structures is mainly inflicted by the vibrotary ground motions resulting from the seismic waves traveling towards the portfolio sites. Inherently, in such a case, the amplitudes of vibratory ground motions at closely located sites are correlated with each other (their amplitudes are similar to each other), and this is referred to as ground motion correlation.
This point leads to the fact that buildings of similar type (e.g., mid-rise reinforced concrete frame-type buildings built approximately in the same time period) would experience similar damage. The similarity in the damage patterns of closely located similar type buildings is called damage correlation.
When the definitions of ground motion and damage correlations are considered together, one will realize the close relation between these two terms. Besides, the similarity of damage in similar building types in a given region would point the clossness of their financial losses as their property values would be approximately the same level. Therefore, consideration of ground motion and damage correlation is crucial for accurate financial loss prediction of a portfolio.
This article summarizes how ground motion and damage correlation interfere with loss correlation in earthquake loss modeling of portfolios. The article starts with the definition of correlation and then shows some simple cases about the variation of portfolio losses when we consider or disregard the ground motion and damage correlation in estimating the financial losses of a portfolio.
Being aware of the impotance of this concept, the earthquake loss modeling experts at T-Rupt continuously work on the improvements of ground motion and damage correlation by using the obsered loss data in Türkiye from past earthquakes. These studies will be summarized in another follow up article
1. What is Correlation?
Correlation refers to the statistical relationship between two or more random variables. It quantifies the degree to which changes in one variable are associated with changes in the other.
Correlation coefficient is used to measure the correlation between two random variables and it ranges between +1 (perfect positive correlation) and -1 (perfect negative correlation). If there is a perfect correlation between two random variables, then the change in value of one variable (either in positive or negative sense) is exactly proportional to the change in value of the other. If two random variables have no relationship between them, then the correlation is 0. These definitions are illustrated in the below Figure 1.
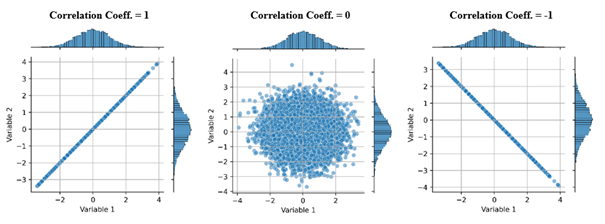
Figure 1. Theoretical definitions of correlation
Note that the change in the correlation (from 1 to 0 and 0 to -1) does not change the distribution of each random variable (that is their marginal distributions). Correlation is only about the order of the samples in the two random variables.
2. Ground Motion Correlation
There are two modes of correlation in earthquake loss modeling: ground motion correlation and damage correlation. We will start explaining these correlation modes and their relation with each other.
Ground motion correlation refers to the spatial dependency of ground-motion amplitudes at the portfolio sites distributed over a region. Ground motion amplitudes at closely located portfolio sites are highly correlated due to the propagation of seismic waves from the same source. Complementary to this point, the correlation of ground motion amplitudes is rather low at the sites that are remotely located from each other,.
There are several studies that quantify the relationship between the ground motion correlation (rhogm) and the distance between the sites (referred to as inter-site distance). Figure 2 shows a sample ground-motion correlation relationship for peak ground velocity. As the plot indicates, the correlation of peak ground velocity is significantly high for sites having inter-site distances less than 2 km. The correlation attains very low values (rho < 0.1) when the inter-site distance between the portfolio sites are greater than 20 km.
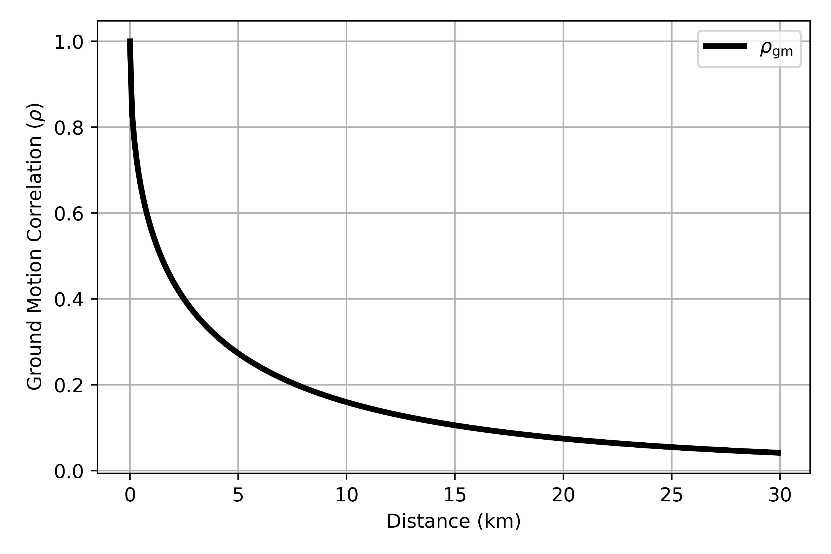
Figure 2. Variation of ground-motion correlation (rhogm) between the two sites in terms of their inter-site distances
3. Damage Correlation
Damage correlation describes how the building damage is interrelated within the buildings of similar type when they are hit by the same earthquake.
The closely located buildings will be subjected to similar levels of ground shaking (ground-motion correlation) and if they carry similar features (such as construction period, structural configuration, construction material, etc), their damage will be highly correlated. Understanding the damage correlation helps us to acquire more reliable predictions of losses. Figure 3 shows the variation of damage correlation (rhodmg) with inter-site distance for similar type buildings.
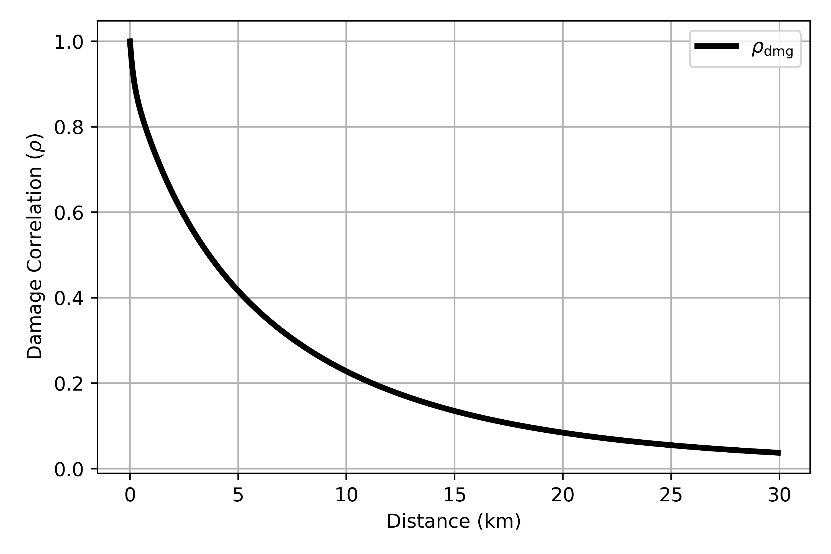
Figure 3. Variation of damage correlation (rhodmg) in terms of inter-site distance for low-rise reinforce concrete buildings built between 1977 and 1999
4. Significance of Ground Motion and Damage Correlation in Portfolio Loss
Both ground motion and damage correlation play an important role in estimating the aggregated portfolio losses. This fact is highligted by the following case, which shows the aggregated loss distribution of two closely located similar type buildings (Building 1 and 2), which are both four story, reinforced concrete frame buildings that are built approximately in the same period.
The top row in Figure 3 shows the loss scatters of Buildings 1 and 2 which show the loss correlations when (a) both ground motion and damage correlation are considered, (b) only ground motion correlation is considered, and (c) neither the ground motion nor the damage correlation are considered in the loss model.
Inherently, case (a) depicts a much clear loss correlation between Buildings 1 and 2 when it is compared to case (b). Inherently, case (c) yileds uncorrelated building losses as it is imposed in the loss model for this case. The aggregate loss distributions of Buildings 1 and 2 are given in the bottom row for these three cases. It is obvious that when both the ground motion and damage correlations are taken into account (red loss distribution), the aggregated losses may attain larger values than the other two cases (green and blue loss distributions); in particular for the case when both ground motion and damage correlation is neglected (blue loss distribution). The last case, obviously is an underestimation of total (aggregated) loss for this simple case.
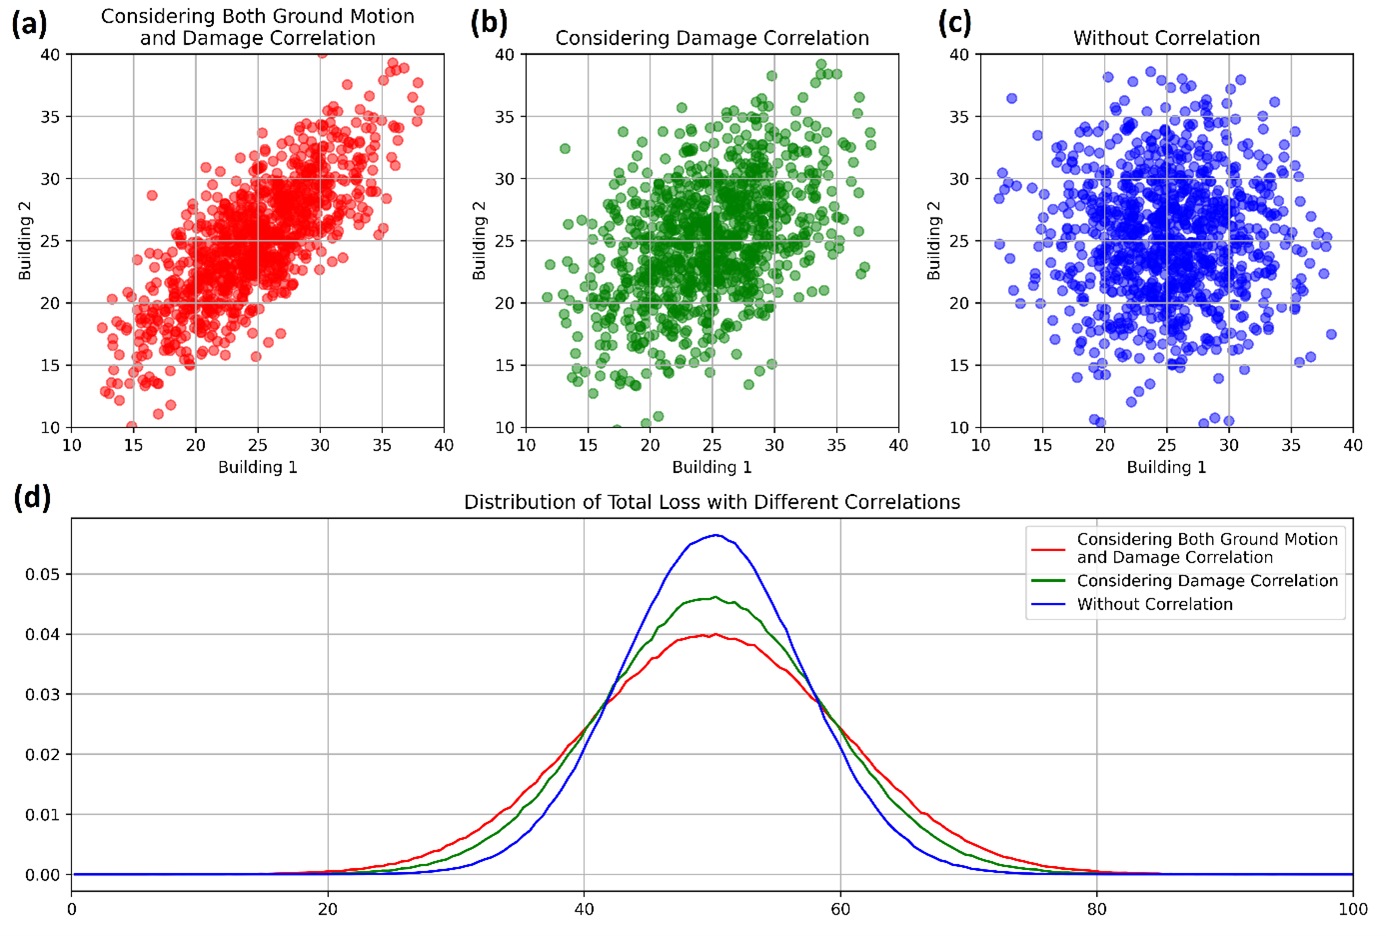
Figure 4. Top row: Loss scatters of two similar type and closely located buildings (Buildings 1 and 2) that show the loss correlations for different cases. Bottom row: Corresponding aggregate losses of Buildings 1 and 2
5. Observations and Conclusions
Ground motion and damage correlations are essential for realistic portfolio loss assessment. Disregarding these parameters will yield inaccurate aggregated losses for a given portfolio. Inaccurate loss estimations would result in the failure of proper risk transfer decisions by insurance and reinsurance proffessionals.
Currently, the loss modelers at T-Rupt work for improving the ground motion and damage correlation for financial loss esstimations of common building types in Türkiye. For this purpose, the modeling experts at T-Rupt consider damage and ground-motion patterns of the recent damaging earthquakes in Turkiye including the February 2023 Kahramanmaraş earthquake sequences of magnitudes (Mw) 7.8 and 7.6, the October 2020 Samos Aegean Sea earthquake (Mw 6.9), as well as the Mw 6.5 January 2020 Elazığ and the November 2022 Düzce-Gölyaka (Mw 6.0) earthquakes.