
𝐎𝐮𝐫 𝐌𝐞𝐭𝐡𝐨𝐝𝐨𝐥𝐨𝐠𝐲:
Using raw data from over 1,800 MGM (Turkish State Meteorological Service) stations, we spatialized the rainfall onto a ~1 km high-resolution grid to calculate area-weighted sub-catchment averages. We then identified the highest rolling 24-hour rainfall for each catchment and evaluated it against a 𝐋𝐨𝐠-𝐏𝐞𝐚𝐫𝐬𝐨𝐧 𝐓𝐲𝐩𝐞 𝐈𝐈𝐈 𝐝𝐢𝐬𝐭𝐫𝐢𝐛𝐮𝐭𝐢𝐨𝐧 fitted to each catchment’s 40-year (1981–2020) annual maximum series. Sub-catchment return periods are scaled from these catchment-level distributions.
Here is what the data reveals across the animation frames:
1️⃣ 𝐂𝐮𝐦𝐮𝐥𝐚𝐭𝐢𝐯𝐞 𝐏𝐫𝐨𝐠𝐫𝐞𝐬𝐬𝐢𝐨𝐧: How rainfall accumulated across sub-catchments over the 50-hour window.
https://www.youtube.com/shorts/oSQg2onWZ8c
2️⃣ 𝐓𝐡𝐞 𝐏𝐢𝐩𝐞𝐥𝐢𝐧𝐞: Our 4-step analytical workflow: Station Data ➡️ Gridded Interpolation ➡️ Sub-Catchment Aggregation ➡️ Return Period Estimation.
https://www.youtube.com/shorts/nbNy1gG0caM
3️⃣ 𝐓𝐞𝐦𝐩𝐨𝐫𝐚𝐥 𝐑𝐞𝐬𝐨𝐥𝐮𝐭𝐢𝐨𝐧: Hourly rainfall progression (partly reconstructed from cumulative station totals) vs. the highest recorded rolling 24-hour window.
https://www.youtube.com/shorts/G0lh8LSSlUQ
4️⃣ 𝐒𝐩𝐚𝐭𝐢𝐚𝐥 𝐑𝐚𝐫𝐢𝐭𝐲: Final return periods mapped by sub-catchment.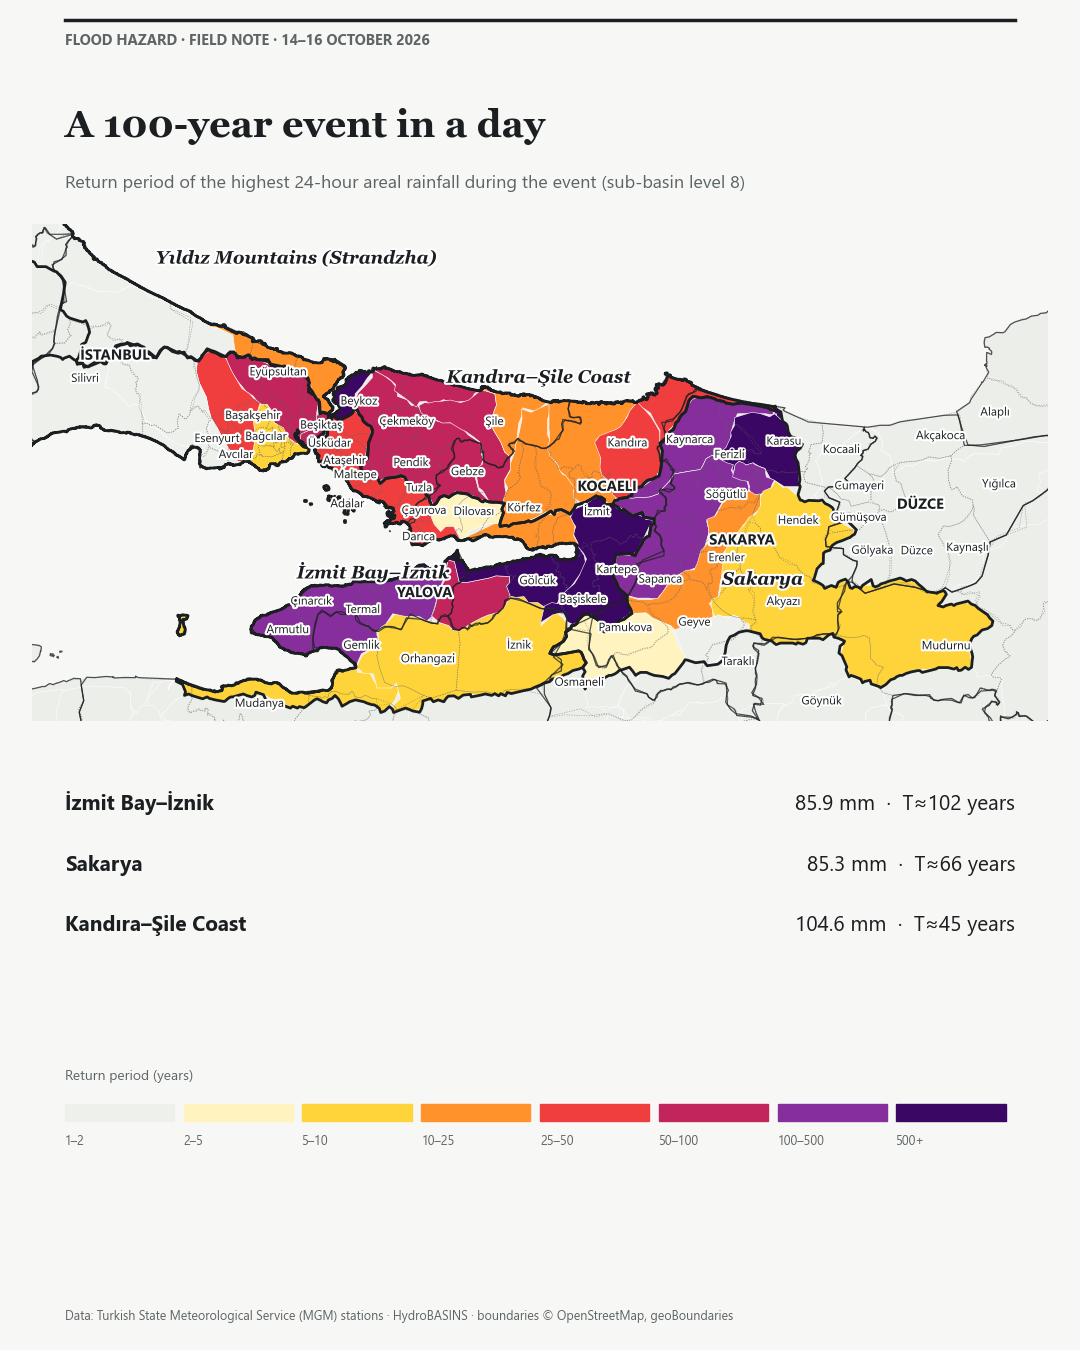
𝐊𝐞𝐲 𝐇𝐲𝐝𝐫𝐨𝐥𝐨𝐠𝐢𝐜𝐚𝐥 𝐈𝐧𝐬𝐢𝐠𝐡𝐭𝐬:
📍 İzmit Bay – İznik: 85.9 mm in 24 hours ➡️ ~100-year return period
📍 Lower Sakarya: 85.3 mm in 24 hours ➡️ ~66-year return period
📍 Kandıra – Şile Coast: 104.6 mm in 24 hours ➡️ ~45-year return period
📍 Karasu Sub-Catchment: Reached a striking 260 mm area-averaged event total.
𝐓𝐡𝐞 "𝐌𝐞𝐚𝐬𝐮𝐫𝐞𝐦𝐞𝐧𝐭 𝐖𝐢𝐧𝐝𝐨𝐰" 𝐏𝐡𝐞𝐧𝐨𝐦𝐞𝐧𝐨𝐧:
A critical takeaway from this analysis is how sensitive return-period estimates are to the accumulation window. Standard daily meteorological totals are counted from 09:00 to 09:00 (the climatological day), and the peak of this storm fell across that boundary, splitting it between two reporting days. In Lower Sakarya, the daily totals suggest a common ~5-year event, while the highest rolling 24-hour total reaches ~66 years. Fixed and rolling windows are not directly comparable, so consistent windows between the event and the historical series are essential for a reliable assessment of flood risk.
𝐒𝐜𝐢𝐞𝐧𝐭𝐢𝐟𝐢𝐜 𝐍𝐨𝐭𝐢𝐜𝐞 & 𝐋𝐢𝐦𝐢𝐭𝐚𝐭𝐢𝐨𝐧 𝐨𝐟 𝐋𝐢𝐚𝐛𝐢𝐥𝐢𝐭𝐲: The statistical outputs and spatial calculations presented in this analysis are preliminary and intended solely for informational, academic, and exploratory purposes. This study utilizes raw, unvetted near-real-time observational data from automated weather stations, which has not undergone final retrospective quality control or homogenization by official meteorological authorities. Where continuous records were unavailable, part of the hourly series was reconstructed from cumulative station totals. The return periods specified herein are mathematically derived based on a localized 40-year historical baseline using the Log-Pearson Type III distribution; values beyond ~50–100 years extrapolate this record and carry wide uncertainty, and sub-catchment values are scaled from catchment-level distributions. Alternative statistical distributions, longer historical baselines, or climate change non-stationarity adjustments may yield significantly different return period estimates. Consequently, these findings do not constitute official administrative data, formal hydrological engineering designs, or actionable financial, underwriting, or legal advice. T Rupt Teknoloji A.Ş. explicitly disclaims any and all liability for commercial, engineering, or structural decisions made in reliance upon this preliminary assessment.
#FloodRisk #CatastropheModeling #Hydrology #DataAnalytics #MarmaraFlood #SpatialData #TRupt